How to Open Task Manager on Mac and Use the Activity Monitor
This guide explains what the Task Manager is on Mac and how to find and use the Activity Monitor. Click the link to read the full guide.
Author:Daniel BarrettAug 16, 20222530 Shares316308 Views
On Windows PCs, the Task Manager is naturally used as a last recourse to killing an app or process when it has become stagnant. It involves different procedures on the Windows and Apple Task Manager. In this guide, we will be explaining what Task Manager is on Mac and how to find and use the Activity Monitor.
If you’re a veteran of Windows, you’re probably familiar with using Task Manager to deal with applications that freeze or check memory usage. On a Mac, those tasks fall to a Force Quit dialog or a utility called Activity Monitor, which has shipped with every version of Mac OS X and macOS since 2000. This guide explains what the Task Manager is on Mac and how to find and use the Activity Monitor.
Apple Task Manager
Similar to the Windows equivalent, in the Apple Task Manager, you can easily quit programs that are unresponsive. But if you want more details about a problem, you’ll need to open the Mac Activity Monitor. This lets you kill unused or unresponsive applications, and consult statistics on CPU and memory load, and energy use. But how do you open the Task Manager on a Mac? And what information is shown in the Activity Monitor? We’ve put together a step-by-step guide to help you out.
Don’t miss: How to Delete Bookmarks on Mac
Force Quitting Programs Using the Mac Task Manager
The Mac Task Manager is a mini-version of the Activity Monitor. To open it, simultaneously press down the [CMD] + [ALT] + [ESC] keys on your keyboard. This will open a window containing a list of all presently opened programs and applications that are running in the background. Select the program or application that has frozen and click on the “Force Quit” button to close it.
Note:The Alt key is also referred to as the Option key. In fact, on some keyboards, it is actually labeled “Option”.
Mac Activity Monitor and CPU Load
Like the Task Manager, the Mac Activity Monitor also lists all of the processes that are running on the system. You can open it by going into Applications and selecting Utilities, or searching for it directly in Spotlight by clicking on the magnifying glass in the upper-right corner of the menu bar.
The Mac Activity Monitor is split into several sections: CPU, Memory, Energy, Disk, Network, and (in later versions) Cache. The record of procedures includes user apps, system apps used by the operating system, and invisible background processes.
You can choose which columns to display and filter the processes by going into the “View” menu. As well as the Mac Activity Monitor, you can also install other programs such as htopto manage system processes.
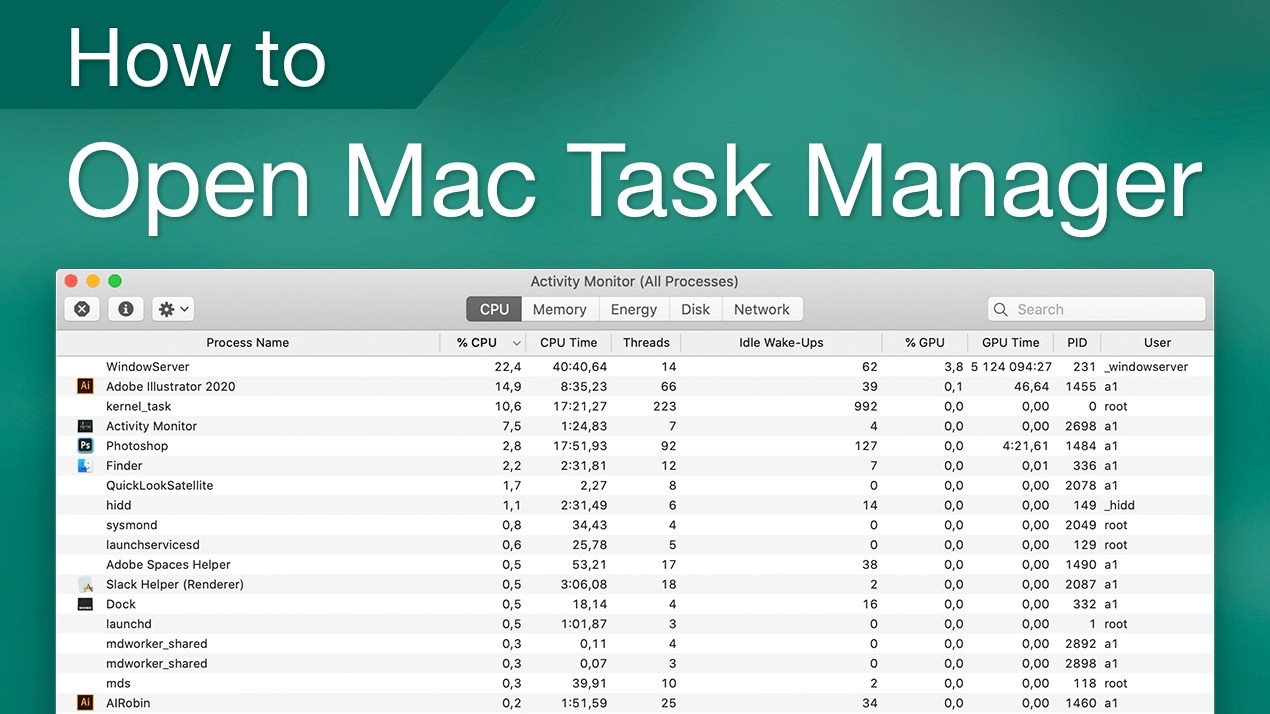
CPU Pane
The “CPU” pane shows how different processes are affecting CPU performance. Alongside the stats in the “Energy” pane, this information can help you work out what processes are affecting the performance, battery runtime, temperature and fan activity of your Mac. Just below the main window, you will see an additional section containing the following information:
- System: Percentage of CPU capability currently being used by system processes.
- User: Percentage of CPU capability currently being used by apps or processes launched by the user.
- Idle: Percentage of CPU capability not in use.
- CPU Load: Percentage of CPU capability currently being used by all processes (System and User combined).
- Threads: Total number of threads used across all processes.
- Processes: Total number of processes that are currently running.
Memory Pane
The Memory pane of the Mac Activity Monitor tells you how memory is currently being used. The section at the bottom shows the following statistics:
- Memory Pressure: This is a graph that illustrates the availability of memory resources.
- Physical Memory: Total amount of RAM installed.
- Memory Used: Total amount of RAM currently in use.
- App Memory: Total amount of memory currently being used by apps and their processes.
- Wired Memory: Memory that cannot be compressed or paged out to the hard drive and that must therefore remain in RAM.
- Compressed: Amount of RAM that is compressed to make space for other processes.
- Swap Used: Space that the memory management system of the OS is using on your startup drive.
- Cached Files: Memory that was recently used by apps but is now available to other apps.
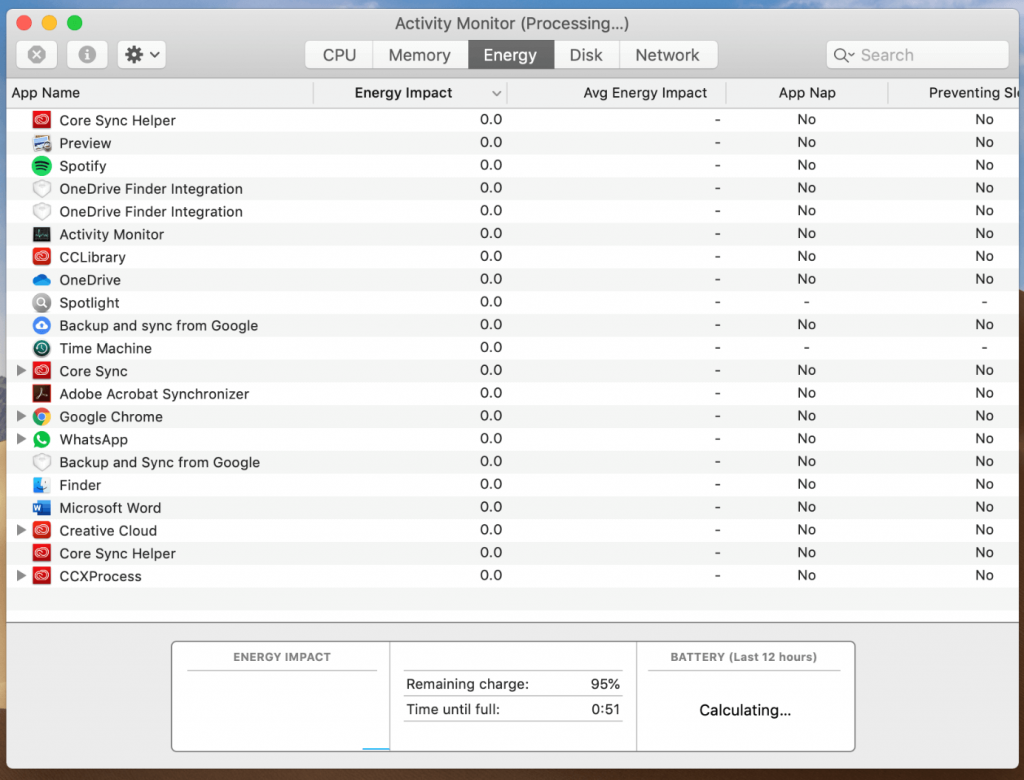
Energy Pane
The “Energy” pane provides information on overall energy use and tells you how much energy is being used by each app. As in the other views, you can click the column headings to sort the processes according to the values measured. The bottom pane shows the following:
- Energy Impact: Total energy used by all apps.
- Graphics Card: Type of graphics card installed.
- Remaining Charge: Percentage of battery charge remaining.
- Time Until Full: The amount of time the Mac must be plugged into the mains before it is fully charged.
- Time on AC: Time elapsed since the Mac was plugged in.
- Time Remaining: Estimated amount of time the Mac can keep running on battery.
- Time on Battery: Time elapsed since the Mac was unplugged.
- Battery (Last 12 hours): Battery charge level over the last 12 hours.
Disk Pane
The “Disk” pane shows how much data each process has read from or written to your disk. It also shows “reads in” and “writes out” (IO), that is, the number of times your Mac accesses the disk to read and write data. The information at the bottom of the “Disk” pane shows the total disk activity for all processes combined.
Network Pane
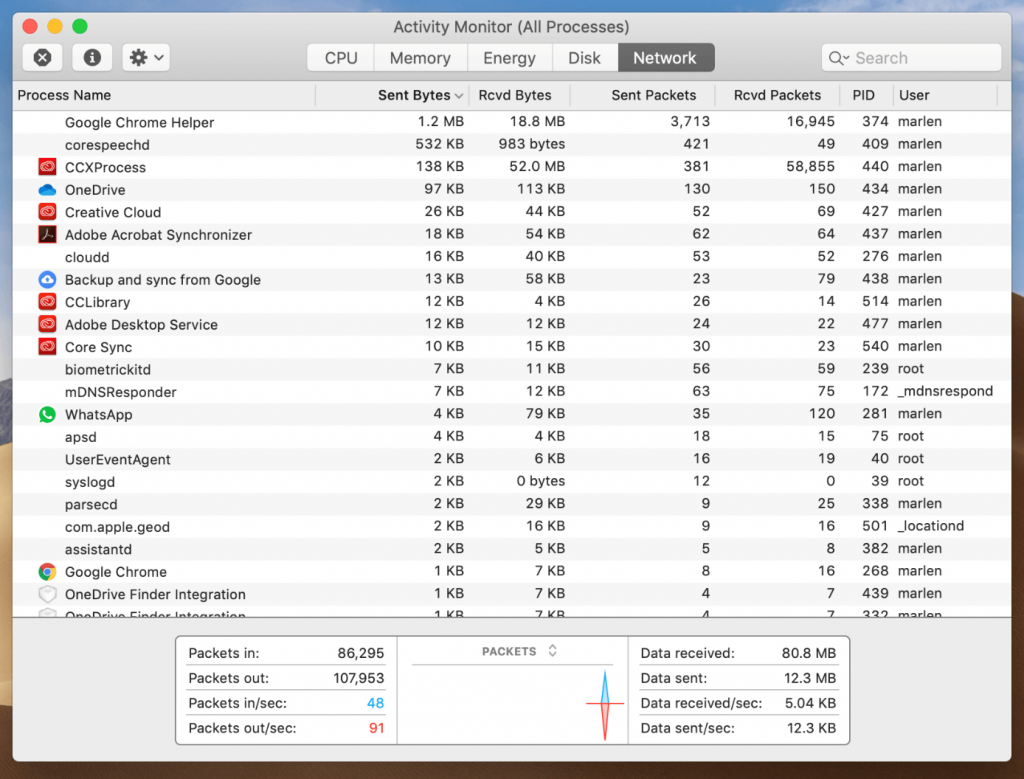
In the “Network” pane you can see how much data your Mac is sending and receiving over the network. This allows you to identify processes that are sending or receiving the largest amounts of data. The information at the bottom of the “Network” pane shows the total network activity for all apps combined.
Cache Pane
In macOS High Sierra 10.13.4 or later, the Activity Monitor has an additional pane called “Cache” (if Content Caching is enabled in the “Sharing” pane of System Preferences). This pane shows information such as how much cached content local network devices have uploaded, downloaded or dropped over time.
Editor’s picks:

Daniel Barrett
Author
Latest Articles
Popular Articles